


Assessments were created and offered to clients as a way to identify more issues than could be addressed during a standard counseling session due to time constraints. The assessments also provide a baseline for progress. In addition to use for counseling, the Behavioral profile identified issues that were used for career counseling. Interpersonal profile was originally created for counseling people who had issues with family, but it became useful for identifying problems with work relationships in career counseling.
This is considered an ongoing project as updates to the process have continued over time with a new update as recently as May 15, 2018.
Creating these assessments posed several problems.
- The Behavioral Profile had seven grading categories to assess seven different driving factors for behavior. A standard baseline for comparison was also necessary.
- A Microsoft word chart was created with a dotted line which represented a normal basis of comparison. Chart labels were added for quick reference
- Microsoft and Excel chart defaults had to be overcome. I learned a great deal about the options and default settings. For example, charts with 96 out of 100 automatically switch the top number from 100 to 120. Data labels and other displays don’t always default to whole numbers.
- Many people do not like to admit to certain behavioral issues, so getting an honest response required an additional grading formula.
- From my experience in research, particularly Psychology, Economics, and Human Behavior, I am aware that people are often not honest about certain aspects about themselves and are so keen to disavow themselves of these negative traits that their denial is so strong they don’t admit it to themselves. So, a new grading formula was created for these responses.
- Codependency and related issues in interpersonal relationships are caused by several factors, and each statement can be reflective of several categories at once, so a different type of grading was required than the first assessment.
- Instead of one response being the only response for that one category, the grading necessitated a way to include a combination of several categories unique to that statement. A new set of Excel formulas and a new type of results chart was created.
- Although the counselors did not require charts in order to interpret results, charts were a better way of showing the client their results to discuss them, so in addition to the grading process, a way to create charts became necessary.
- Not only were charts created, an additional results handout was created that includes an automatically updating set of fields to accompany the interpretation of the results.
- TIME! For the Behavioral profile, it could take up to 40 minutes to properly grade and create a report of results for this one assessment. The Interpersonal profile could take just as long.
- For stability and accuracy and to identify inconsistency in responses, some statements are rephrased which means there are additional responses to grade, which is good for accuracy, but it increases the time to grade.
- Since the Behavioral profile required many “flipped” responses, updating the response to the opposite (but for our purposes, true) response took additional time, and when working with paper or non-digital responses, it was necessary to double-check, which took even more time.
- Offering the assessments as part of a workshop also hastened the need for a faster process.
- Filling out the assessments on paper was more time consuming for the client and many clients were not able to figure out how to scan or send scans, and many resorted to taking photos with their phones, which usually involved inadequate lighting and reading handwritten responses also posed a problem.
- All time constraints were resolved by offering the assessment online, particularly to improve the client experience.
The original assessments’ grading:
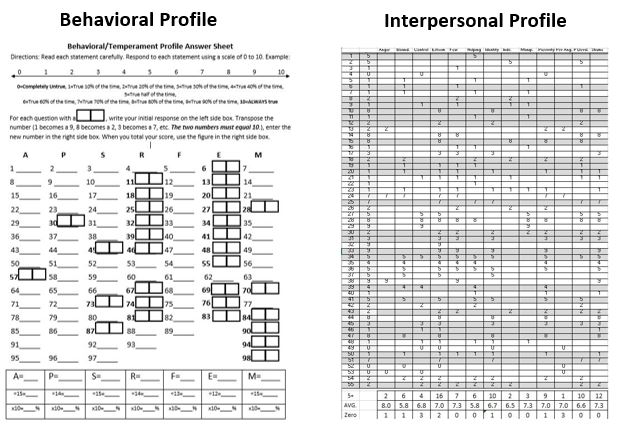
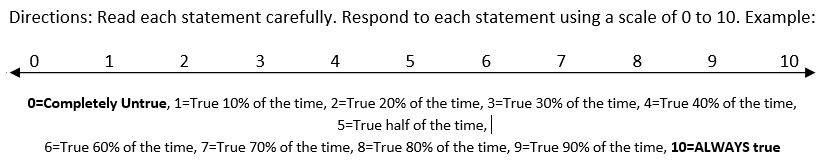
For both assessments, the client was instructed to answer on a scale from 0-10 to indicate how often that statement is true for them, with 0 being “untrue” and 10 being “always true”.
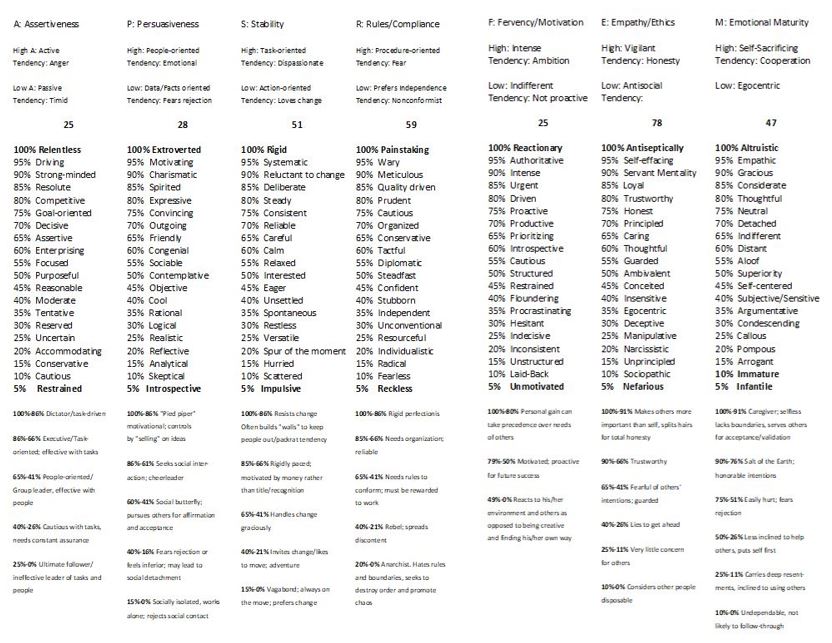
Behavioral Profile
Statements: 98
Categories: 7
This profile shares similarities to the DISC profile, but instead of 4 categories, the assessment measure 7 categories.
- Assertiveness: Similar to DISC’s Dominance category.
- Persuasiveness: Similar to DISC’s Influence, this category measures how much a client uses their words instead of being aggressive to accomplish goals.
- Security: Similar to DISC’s Steadiness, it measures how open a client is to change and how much stressors (such as financial stability) affect the client’s decisions.
- Rules: Similar to DISC’s Compliance, it measures how important following rules is to the client.
Additional categories
- Fervency: Measures motivation/grit; how likely a client is to persevere or give up on their goals.
- Ethics: Measures how ethical the client is—independent of religion and can be used for secular clients as well as clients from a variety of religions.
- Maturity: Measures emotional Maturity, coping skills, and how subjectively the client perceives situations.
Since it is difficult to get a truthful response for statements that a client prefers not to admit—especially if the client is from a particularly shame-based upbringing and/or shame and guilt-based religion, questions were phrased in a “devil’s advocate” manner, more likely to elicit a truthful response. For this reason, the segments for Rules, Ethics, and Emotional Maturity have the most “flip-flopped” responses. A client who wants to appear “holier-than-thou”, which is common for a client base that is primarily Christian, won’t admit to holding certain opinions.
For example, the client would prefer not to admit that they would agree that they find it even somewhat acceptable to use another person to get ahead in life. When phrased in this manner: “It is not acceptable to use other people to get ahead.”, the clients agreed, and gave that statement a 10. When this was switched and phrased in a “devil’s advocate” manner, “If you want to get ahead in life, you have to use other people.” It was more common to get responses in the affirmative, even if it was only a “2”, it was more accurate in revealing their true feelings/motivations. By rephrasing, the way the statement is presented, it appears to give permission to admit something they might find socially unacceptable, but at least occasionally acceptable for their own personal values. By entering a “2” as a response, their flip-flopped score is actually an “8”. Compared to the standard response of the originally phrased question, this is far more accurate than the standard “10”.
Since I had not yet found an Excel formula to “flip-flop” responses, grading took a while, even after I was able to create excel formulas for some of the process.
Interpersonal
Statements: 55
Categories: 13
A client’s codependency can manifest itself in many aspects of their relationships. This assessment measures several categories of codependency. Using Excel formulas, I only needed to fill in the original response, and the answer could populate in that row for several different category rows at once because the response to the statement would reveal information needed to chart several categories at the same time.
For example, the statement “I treat other people better than I treat myself.” is used to measure four categories: Esteem, Identity, Personal Devaluation, and Shame.
A set of charts were later created for results. The original intent was not to create a chart, but to find out how high a client’s response was in each category. Charts were later created to illustrate to clients how much particular issues affect their interpersonal relationships. Responses over “5”, meaning that statement is true for them at least half the time, was the deciding factor for calculations in how deeply the issue impacts the client’s life.
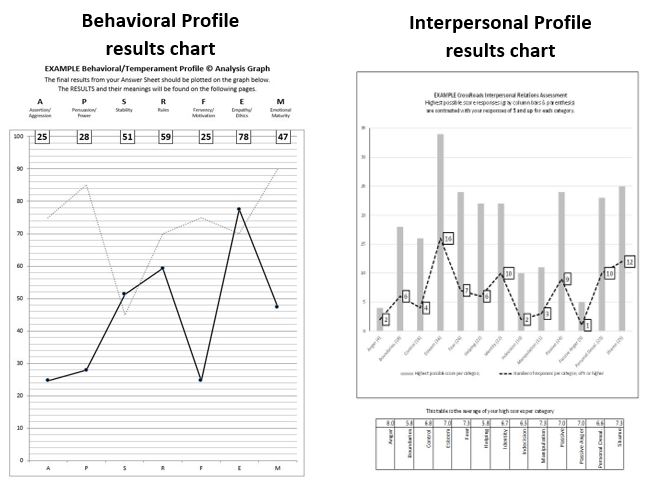
Charts
Both charts show the results with a basis of comparison. For the Behavioral profile, it’s a “norm” for recommended scores for a well-adjusted person. For the Interpersonal profile, there are two charts. The first chart compares total responses to the total possible, and the second chart shows how high the responses are on average to show how high the average response is to a category that had a result showing an affirmative answer for at least 50% of the time. Instead of a norm for the Interpersonal profile, it is recommended to have the lowest possible score.
Formulating results: Behavioral Profile
I used a Microsoft Word chart and used several Excel formulas to calculate results. The results populate in more than one field which is primarily for spot-checking accuracy. This “behind the scenes” formula page is not seen by the client when results are printed.
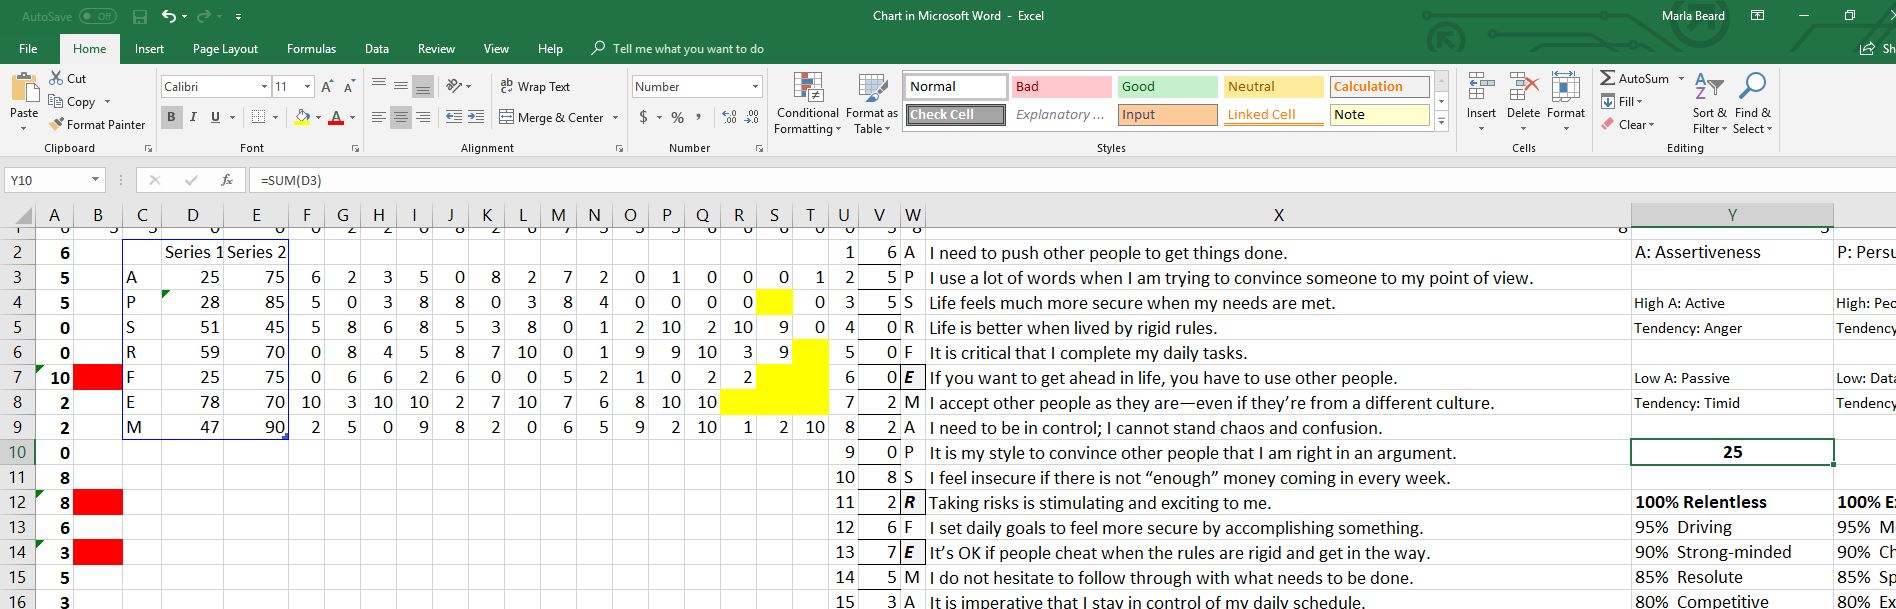
Series 2 is the dotted line which is used as a basis of comparison. Series 1 is the solid line used for the client’s results. Client responses are entered in the top line, row 1, which has been set not to print when results are printed.
Several default features on Word were changed. Charts that go to 100 default by going up to 120 when the results go above 95. I changed the document’s default so that the chart never exceeds 100. Results also default by showing too many decimal points. Using automatically updating tags on each chart shows results with the values that are most useful.
Counselor Results handout for Behavioral profile
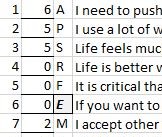
The counselor receives a handout which shows the number of the statement, the client’s response for each statement, and the category for each statement is indicated. The statement is included for faster reference. The statements with “flip-flopped” scores are also indicated with the field marked in gray along with a bold, italicized letter for the category. The counselor gets a copy of this plus the clients’ results handout. This is as simple as selecting to print a specific range of pages for both the client and counselor.
Client Results handout for Behavioral profile
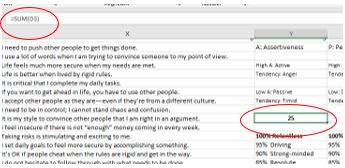 The client’s result score for each category is automatically printed with an explanation of what the results mean for their score. This process is streamlined by printing specific pages in Excel. This was how I avoided printing more than one chart to go with results. I re-created the format of the results handout and included a SUM= function to have the score automatically populate on the handout field which corresponds to the category when the client’s responses from the testing site are entered.
Formulating results: Interpersonal profile
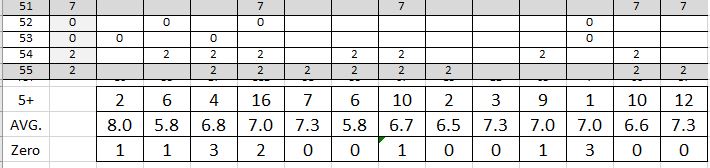
5+: Since answers that are 5 and up register as being true at least 50% of the time for the client, it was decided that the chart would show the number of positive responses. This was accomplished with a COUNTIF function.
AVG.: This shows the average not of all points overall, but an average of all scores 5 and up. This shows how high the client falls into the category on average.
Zero: Although it does not register on the handout chart of results, the counselors have found it useful to know if the client entered many zeros for a category’s responses.
Counselor Results handout for Behavioral profile
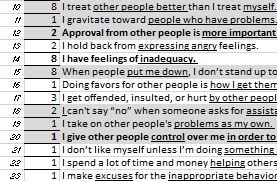 Statements that were of greater significance were marked in gray and phrases that the counselors felt were even more important to have for quick reference were marked in bold and some parts underlined. Responses with a corresponding statement number were included for quick reference. This was accompanied by the same chart given to the client.
Client Results handout for Behavioral profile
The client receives the same chart shown earlier in the “Charts” section which includes the client’s positive responses compared with the total possible per category and the average per category (on a 10-point scale).
The following image is the full handout which gives a general explanation with the client’s score for interpretation including information on what a high or low score in the category means, and brief description for the general score range. This is explained to the client during the session, but it is useful to have a copy for reference to reinforce the information.
Publishing Online
An exhaustive search for a site, service, plugin, or software to publish the assessments online included the following criteria:
- Ease of login/minimal information for the client to remember
- No login passcodes that would make it necessary for the client to contact us for password resets or other high-maintenance issues
- Easy to keep client’s information confidential
- Ability to retrieve results
- Cost-effective and few restrictions/no need to sign up for a plan, package, or level for a certain number of assessments per month
- Create reports including the various criteria including the “flip-flopped” results and charts
After researching several providers, including survey companies, a company was found that provided all but the last request. The results are exported in CSV. After opening the file and copying the row, I only need to paste the results into the top row of the corresponding assessment’s grading page, save, and print the results. Confidentiality is provided by a secure site, clients can create a username. As an additional security measure, client’s results are deleted from the database after grading.
Client experience
As a value-added bonus for clients, assessments were created and offered to clients at no additional charge. CrossRoads’ Director wanted to identify more issues than could be addressed during a standard counseling session due to time constraints. The assessments also provide a baseline for progress.
Instead of receiving 2 paper assessments (or attachments to download and print or download, complete, and return) which require scanning results or sending pictures, clients can now click submit. This improves the user experience with speed and simplicity as well as providing the client with an additional service for faster results in counseling.
UPDATE: Ongoing project
As new skills in Excel are learned, updates are made to improve the process of generating reports. One such update to the process was made in May 2018. The report process has shifted from a linked Word document to running the entire grading and generation of chart and reports in Excel only. This reduces the possibility of error in saving the document to its proper file.